Helping PMs Plan Sprints in Jira Without the Guesswork.
Jira already contains the information teams need to plan a sprint. The problem is that it's scattered across different screens, tools, and conversations forcing Product Managers to piece everything together before making a decision.
PMs, stuck in the same loop.
Imagine you as PM who just finished a sprint and now has to plan the next one. It's Monday morning. You open Jira and start dragging tasks in.
30 story points. Everything looks fine. You are about to click Start Sprint.
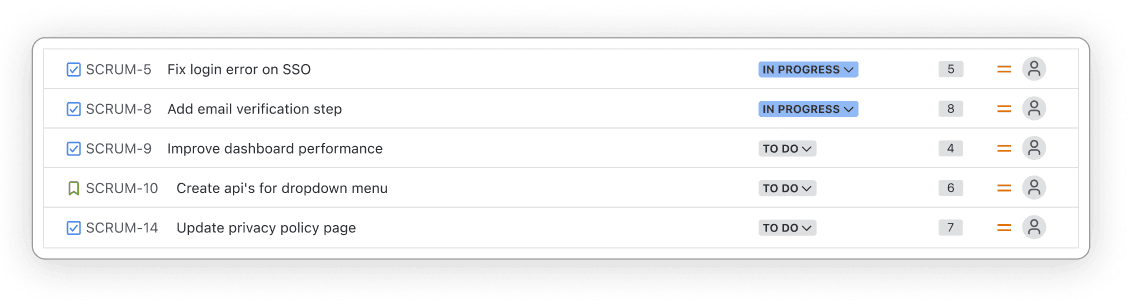
But then the questions start.
Q1. Can my team actually finish 34 points?
Jira shows what has been planned, but not whether the workload is actually achievable for this team.
Q2. Is this sprint realistic?
Without seeing previous sprint outcomes alongside the current plan, it's difficult to judge whether the team is overcommitting.
Q3. Who's unavailable next week?
Leave, holidays and unexpected absences usually live in calendars, Slack or someone's memory not where sprint planning
Q4. Does any task depend on another?
Task relationships exist, but they're buried inside individual issues, making blockers difficult to spot before the sprint begins.
Eventually, you stop relying on Jira alone. You create your own planning spreadsheet, check Slack to see who's on leave, and go back and forth with the team when someone is overloaded just to reassign the work.
I didn't trust my own itch.
Before designing a single screen, I wanted to know if this was actually a problem worth solving. I started by looking at how the problem was being handled elsewhere and whether other products had already recognised the same gap.
Let’s see what the competitor doing
Linear is a modern project management tool built around fast sprint planning and software development workflows.
Even competing tools recognised that sprint planning needs more than a backlog. Linear introduced Cycle Capacity to help teams understand whether a sprint is realistically achievable before it starts. That validates the same problem I was trying to solve—planning shouldn't rely on memory or guesswork.
However, capacity is only one part of the planning process. But we understood that the problem was real and competitors had a solution for it which would have cost users retention to the jira
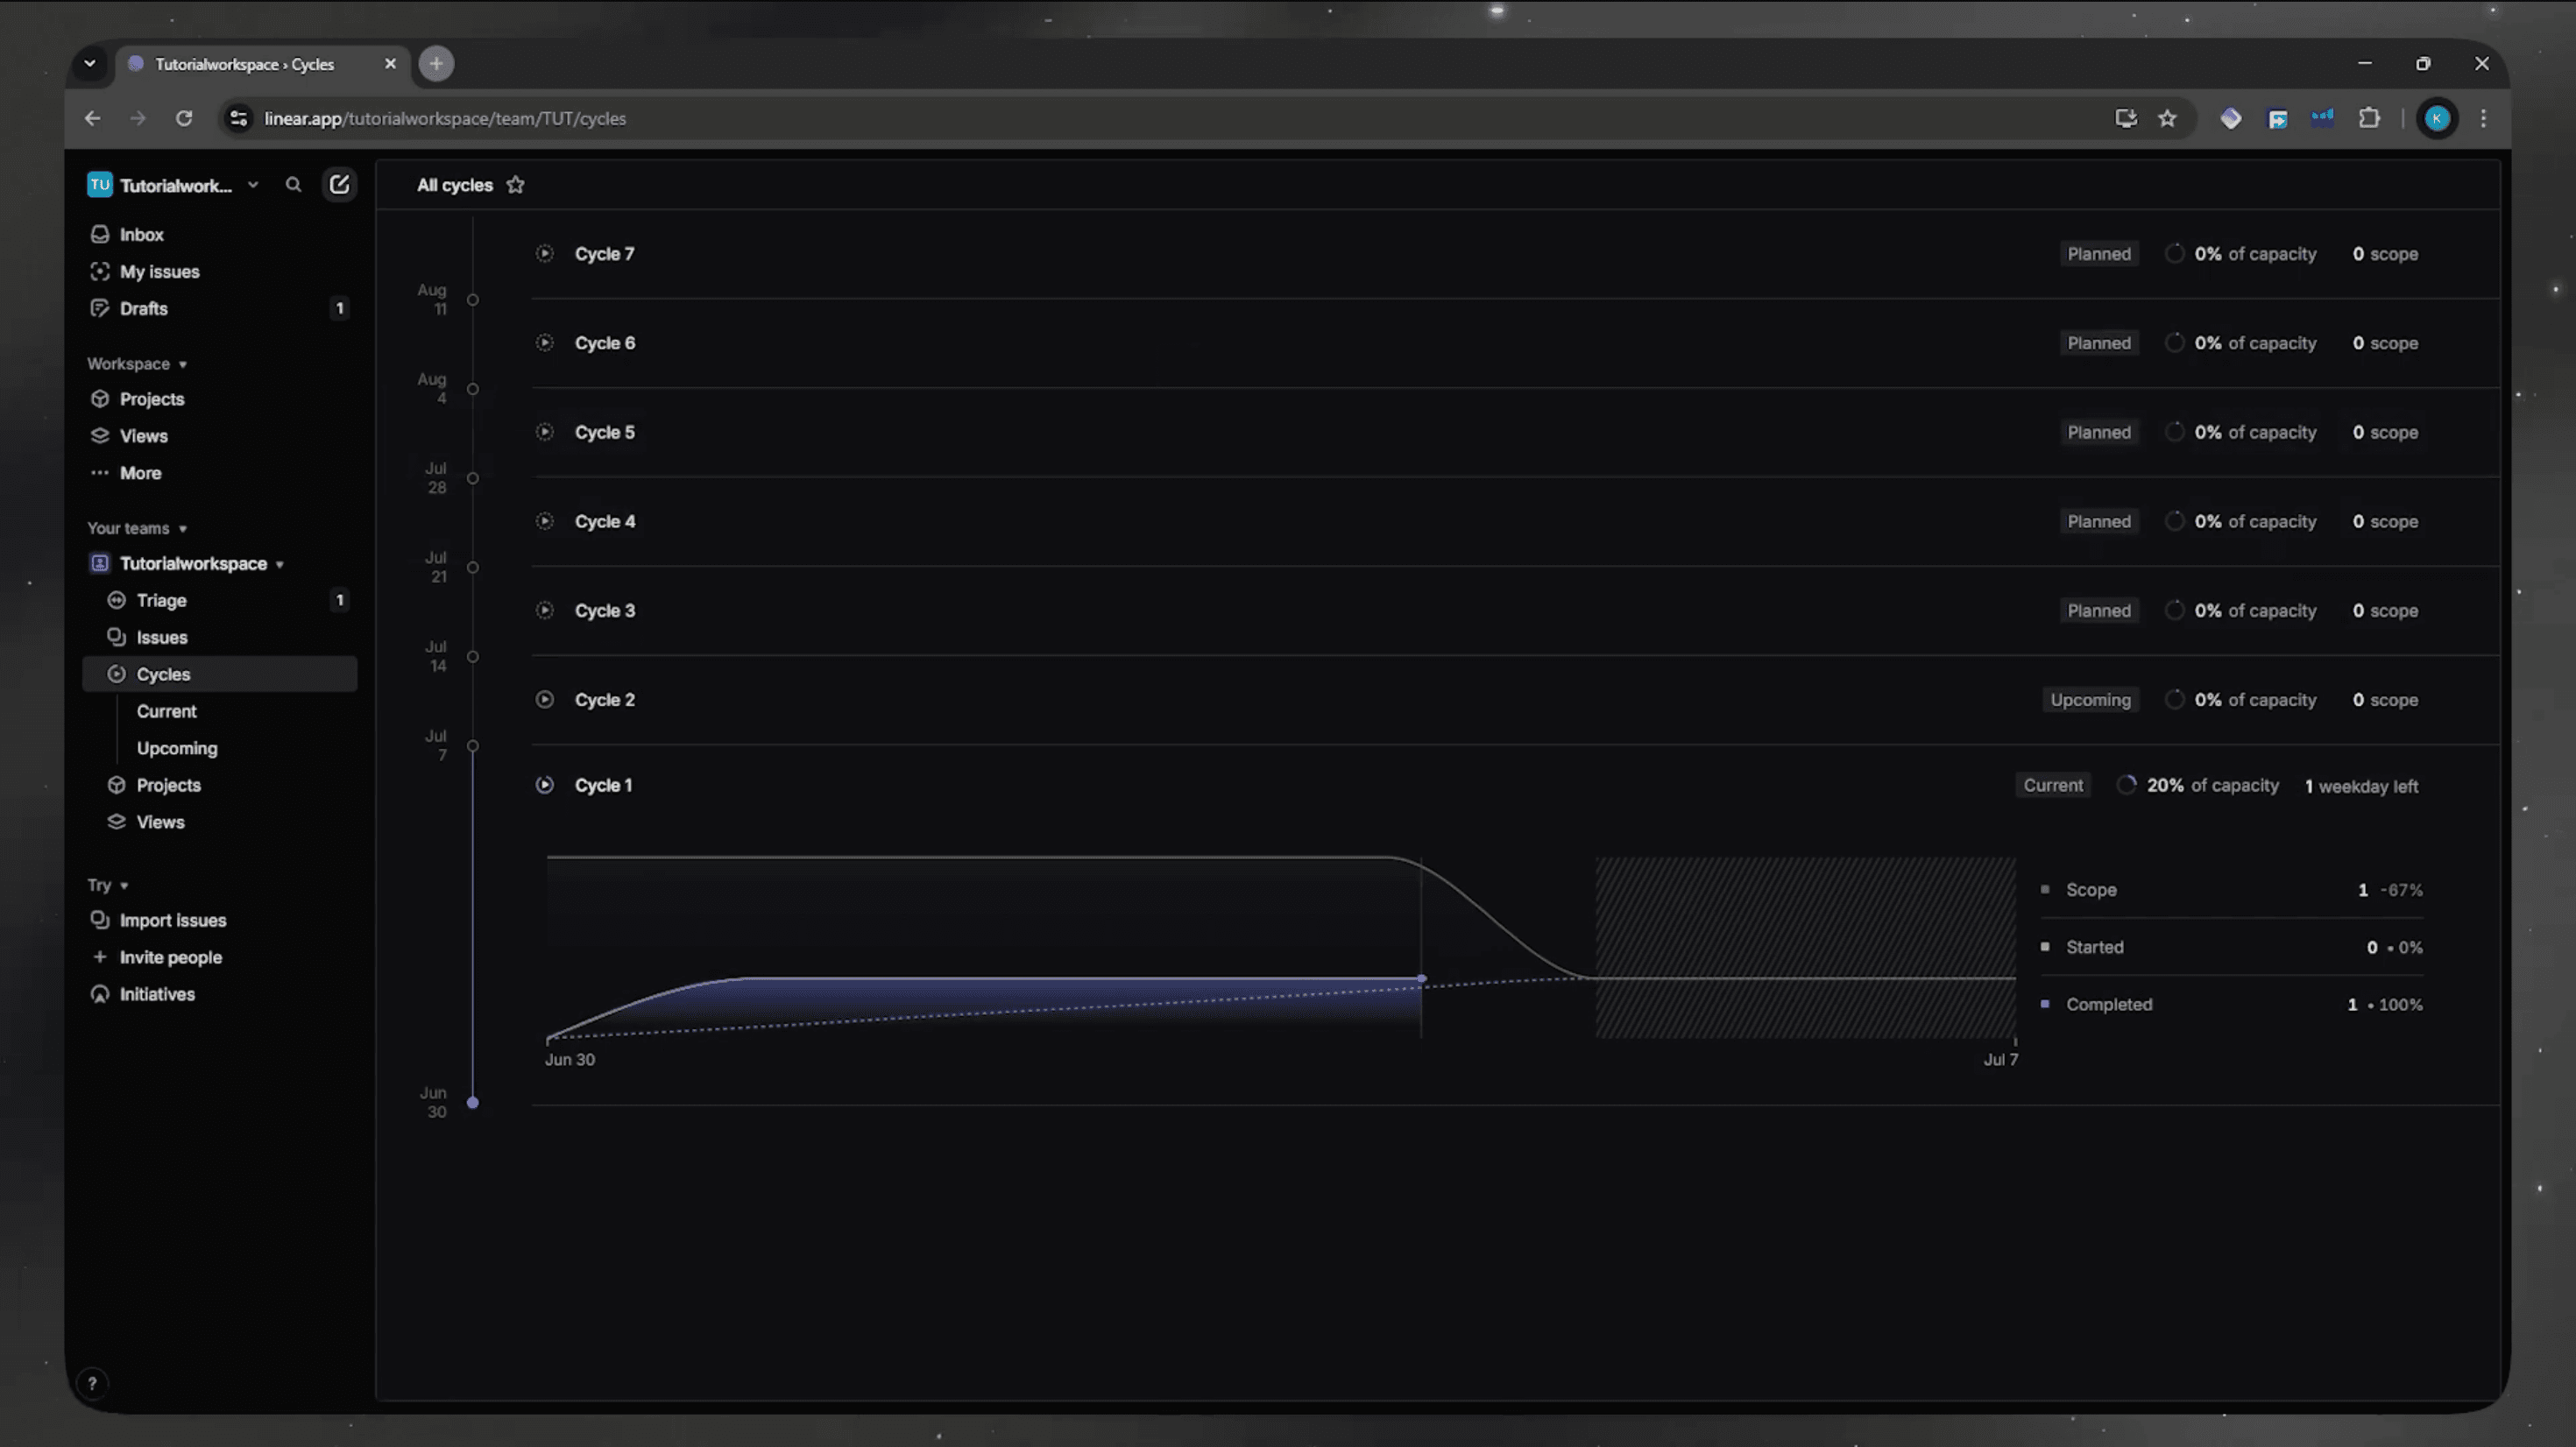
Linear brings capacity and progress into the same view, so teams can see how much work they’re taking on.
Before solving the problem, I defined what couldn't change.
Solving a problem is about changing everything. Some parts of the product already work well, and changing them would create more problems than they solve. These were the boundaries that shaped every decision I made.
The data already existed.
Everything I needed was already somewhere inside Jira. Capacity, velocity, leave, and dependencies weren't missing they were scattered across different screens. My goal wasn't to invent new data, but to surface existing information where sprint planning actually happens.
Don't Break Existing Workflows
Sprint planning already works. PMs know how to drag issues into a sprint, reorder work, and start planning. I wasn't redesigning that workflow I was making it more informative without changing how people already work.
Stay Consistent with Jira
This shouldn't feel like a new product. Every component, interaction, and visual pattern needed to feel native to Jira so existing users wouldn't have to learn a different interface.
Keep Information Dense
Jira is built for power users. PMs expect to see a lot of information without opening multiple screens. Any new feature had to add clarity without making the backlog feel heavier or more cluttered.
These constraints became the framework every design decision had to fit inside.
How Everything Connects
These weren't four separate problems. They were one planning system.
At first these looked like four separate problems. But the more I mapped the planning process, the more I realized they were all connected. If someone is on leave, the team's capacity changes. Lower capacity means work becomes unevenly distributed. An overloaded teammate can delay tasks that others depend on. Those delays reduce the amount of work the team actually completes, making the sprint harder to finish. None of these problems exist on their own—they're all part of the same planning system.
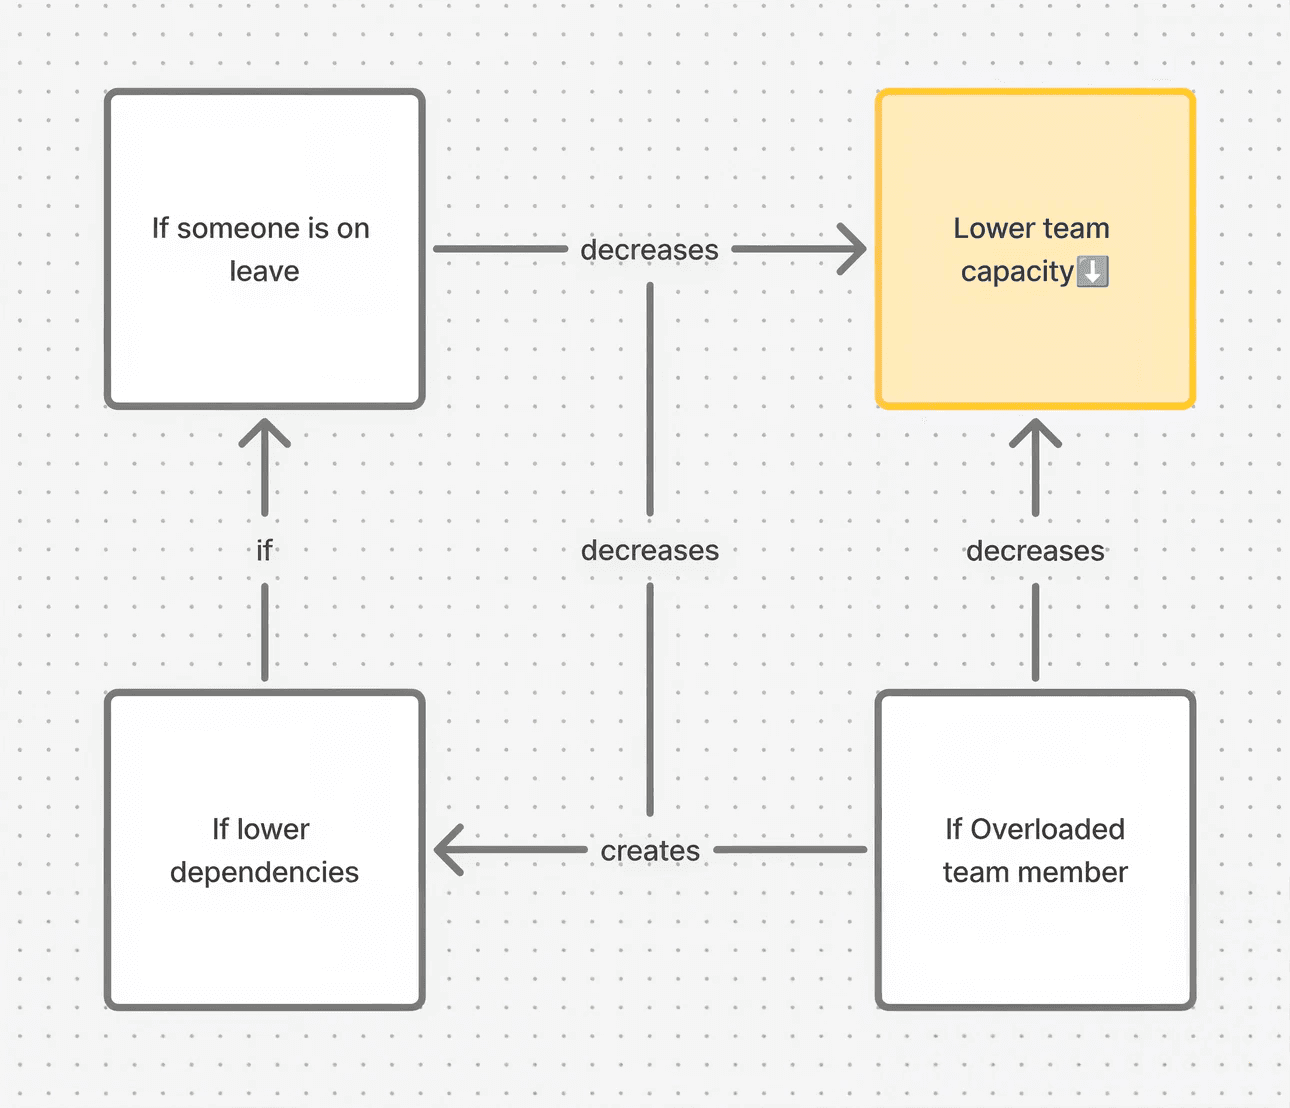
Mapping the relationships between the four planning problems before exploring potential solutions.
Once I understood how everything connected, I mapped what was worth solving.
Instead of jumping straight to features, I broke the planning system into opportunities. Each opportunity had to support the same goal: helping PMs make confident sprint planning decisions.
I used the ost framework to solve this problem. What’s ost?(*for nerds like me)
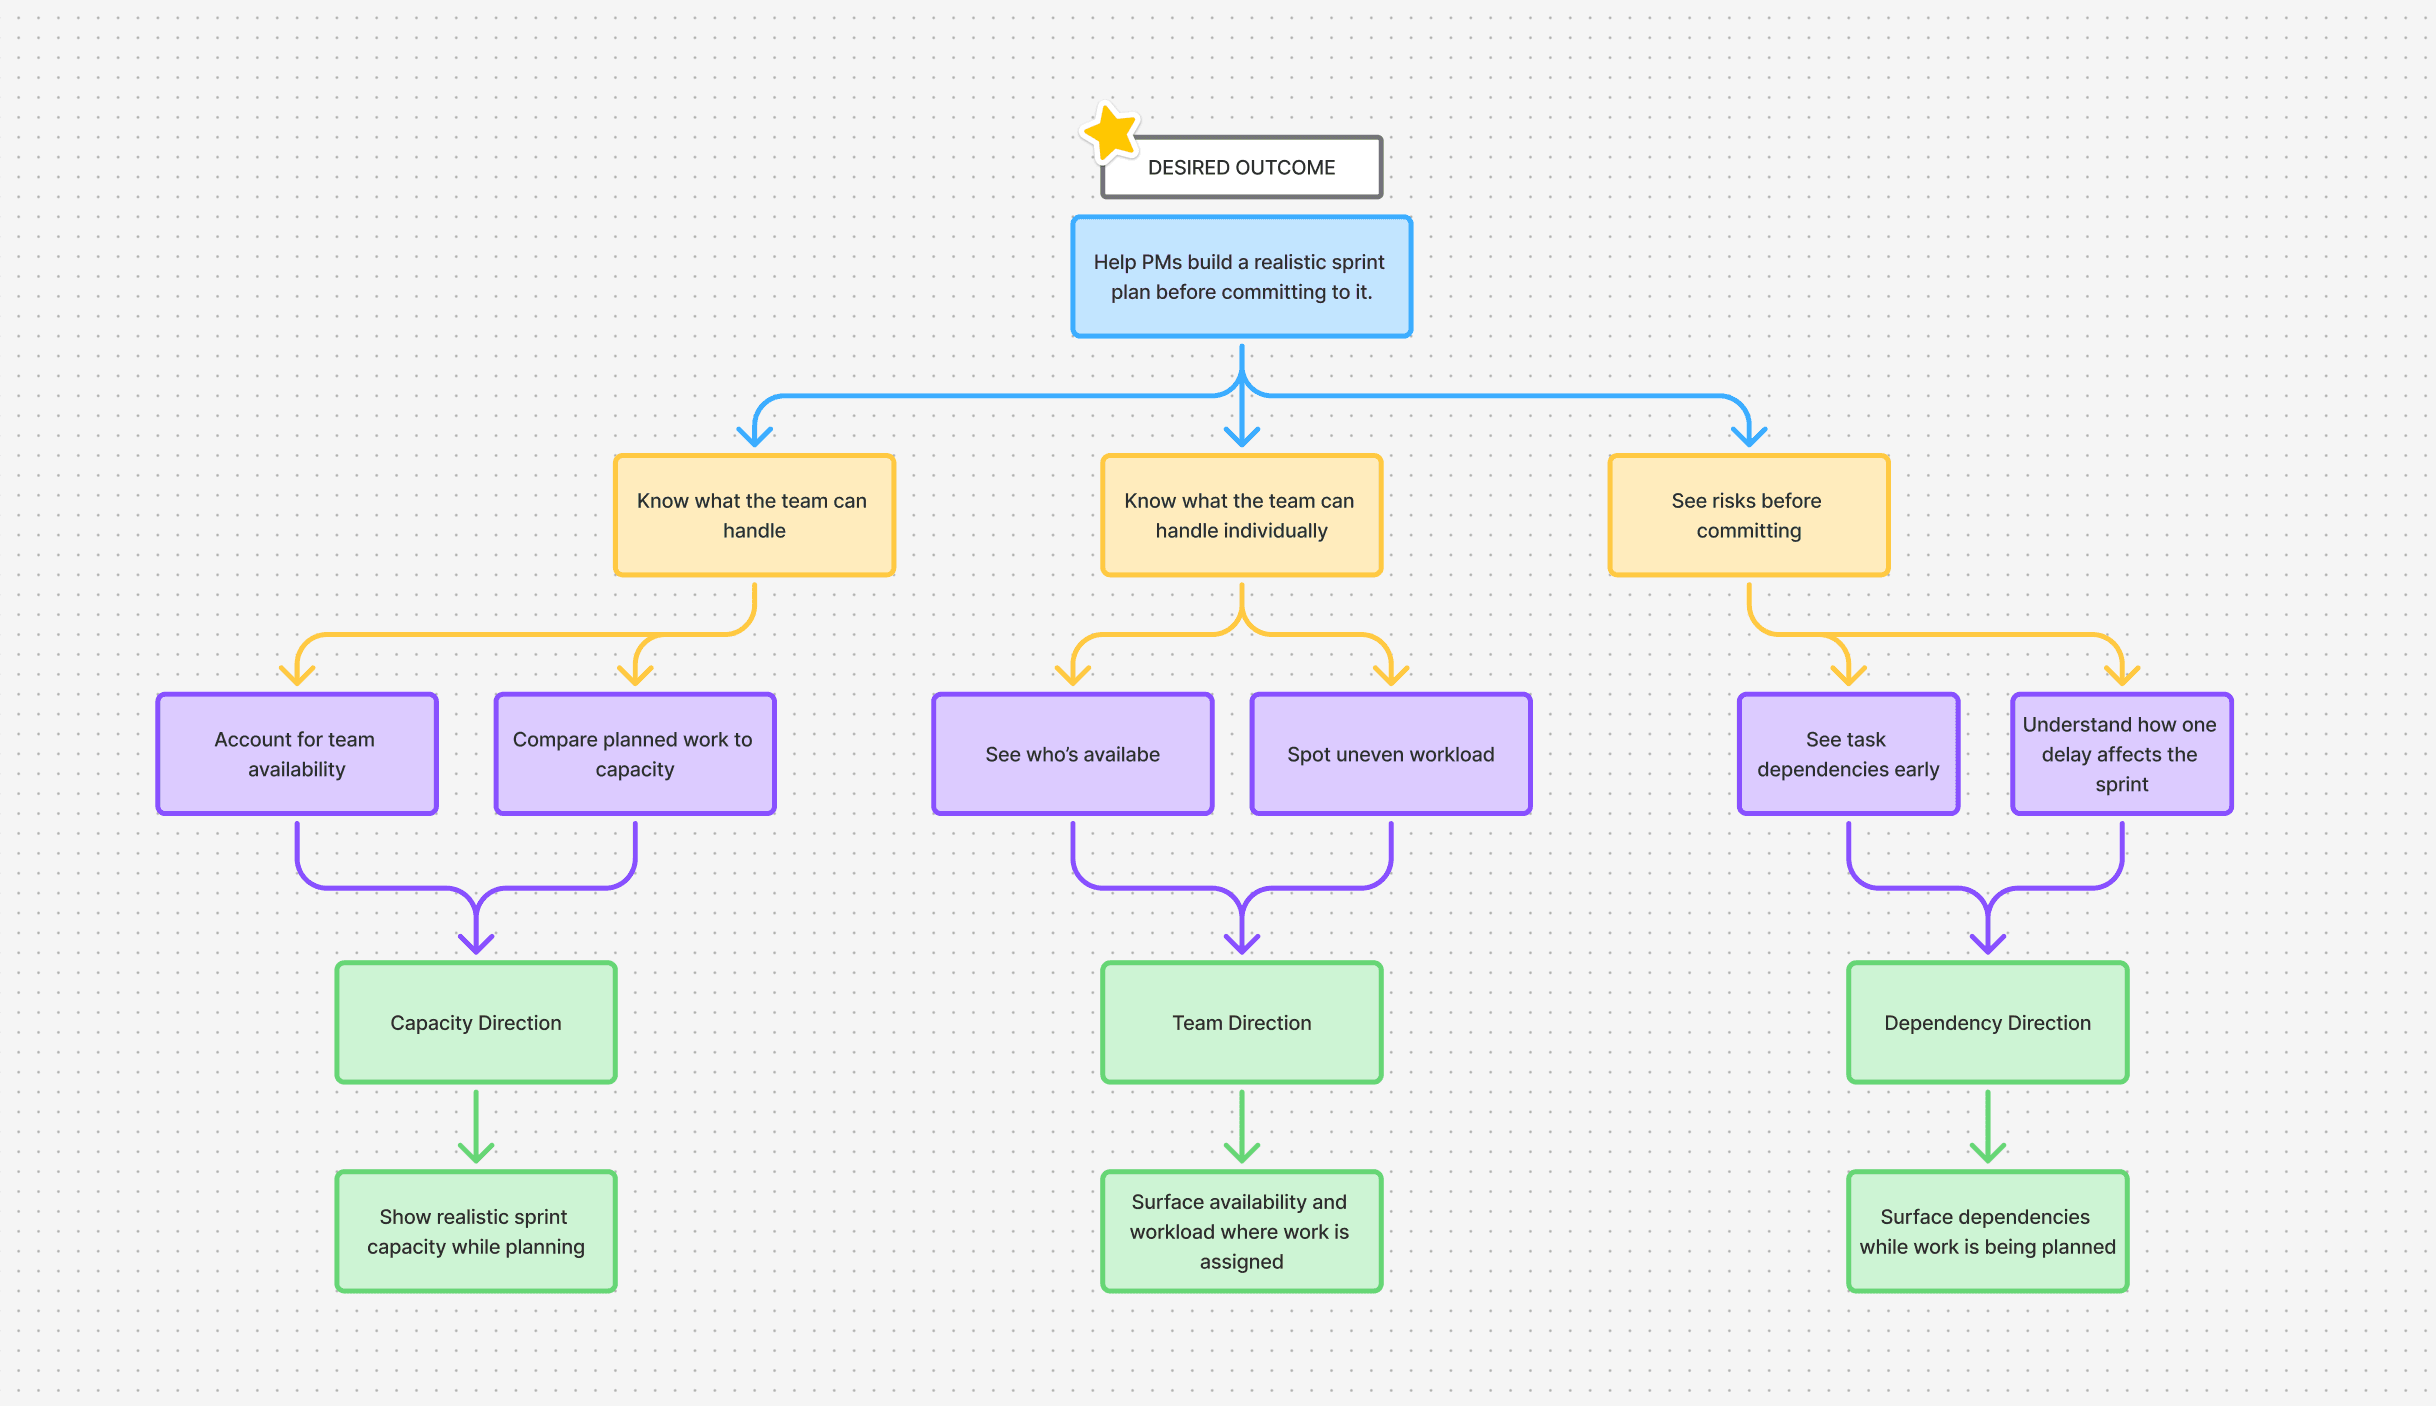
Opportunity Solution Tree used to map validated planning problems into solution directions.
The tree became my decision filter. Every feature in the final design traces back to a validated planning problem—not an assumption or a random idea.
What I added. And why.
Jira already had the data. It just never showed it at the right moment. I didn't build new features. I surfaced what was already there in three places, at the exact moment Sarah needs them.
Now she knows if 34 points is realistic.
The sprint header now shows capacity not just the number of points committed, but whether that number makes sense for this team based on the last three sprints.
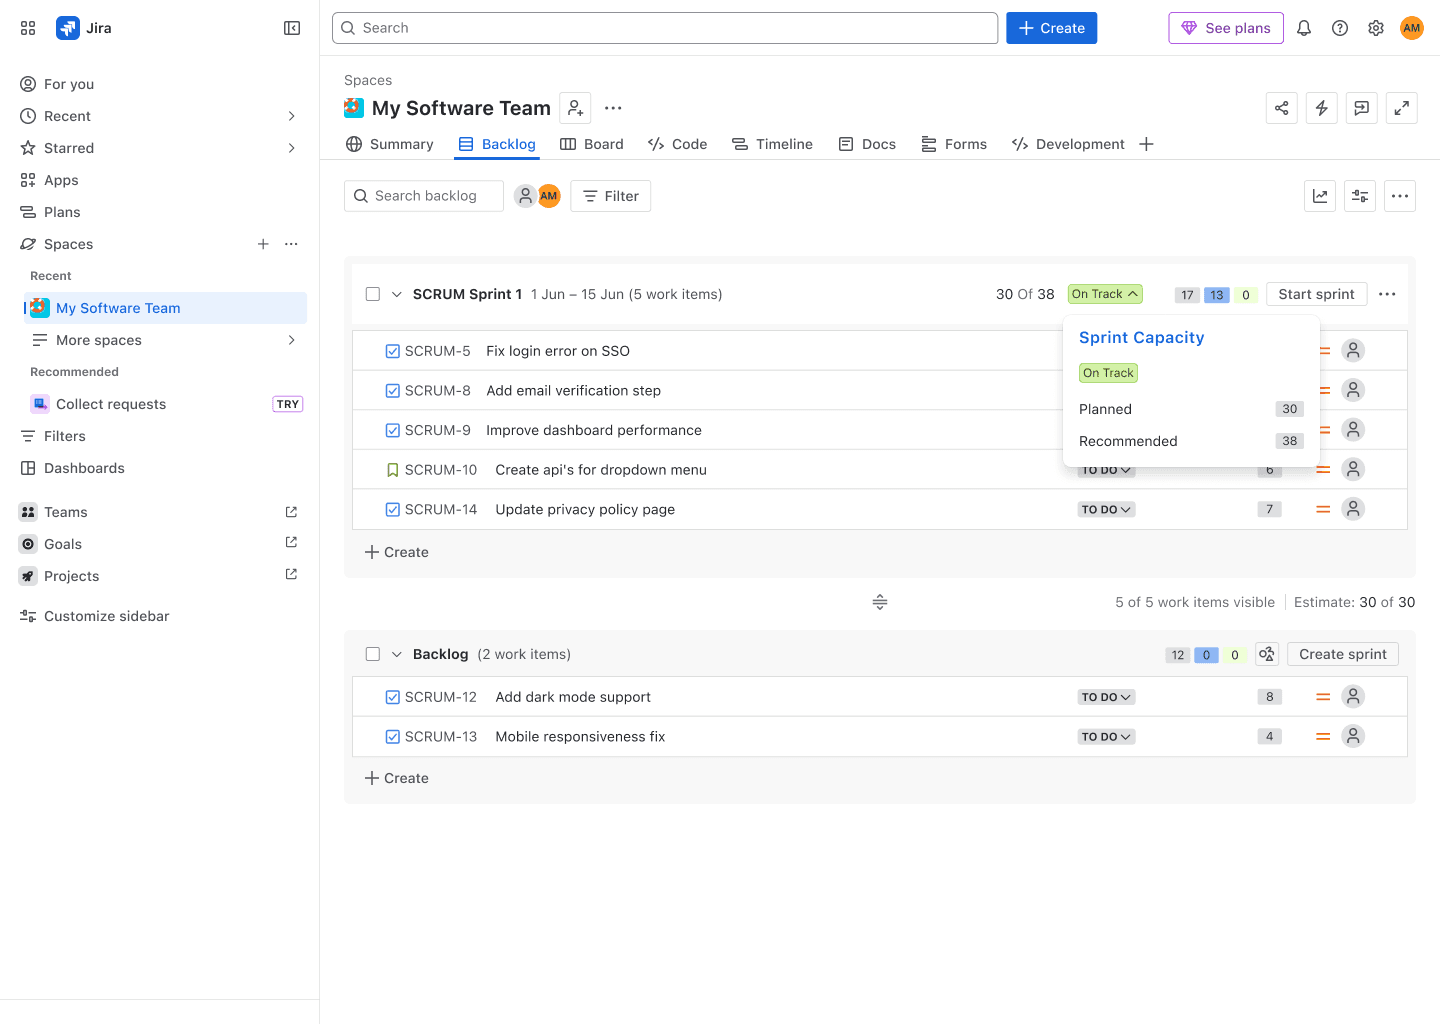
Recommended sprint capacity surfaced directly during planning

FIrst I considered pulling this automatically from calendar integrations. But breaks the moment someone is on a partial week or a contractor changes hours. So I went with suggested and editable.
Planning with recommended capacity with editable options

The system calculates a recommended capacity from recent sprint velocity and shows it upfront. Sarah can override it in one click. The system suggests. It never dictates. Hover the status badge and it tells you exactly why based on 3 sprint avg velocity, The reasoning is visible. Not just the answer.
Now she knows if the sprint is realistic.
Team Status. A panel that shows every team member, their current load, and their leave — without Sarah opening a single calendar or sending a single Slack message.
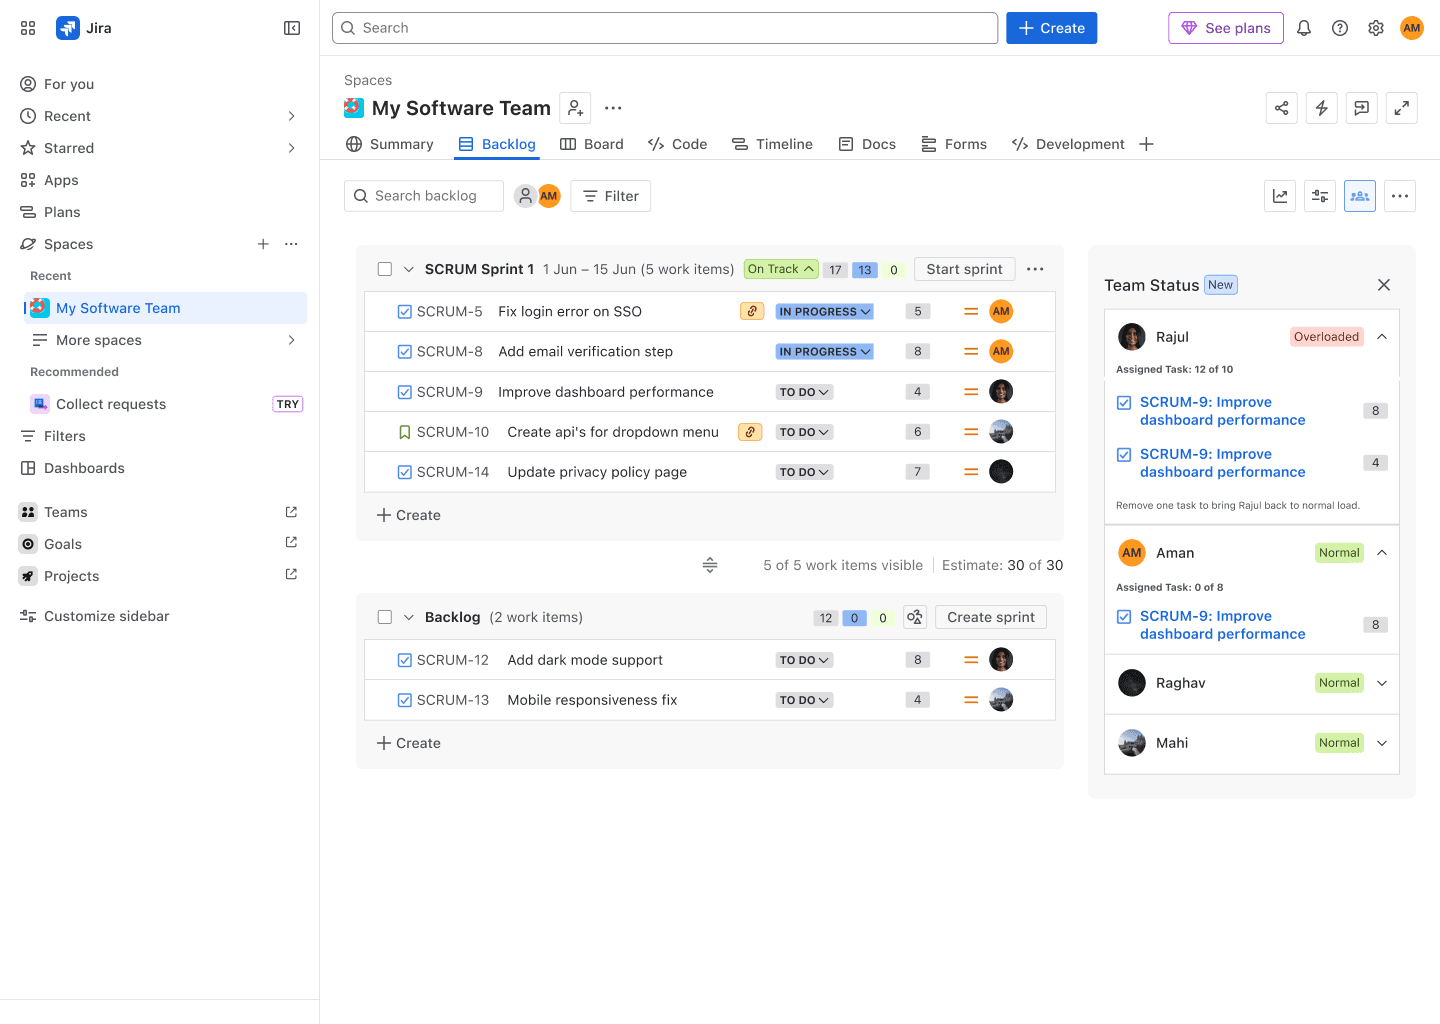
Only story points are calculated in team status
I could calculate workload from story points alone. But 8 points doesn't mean the same thing when someone is available for ten days versus five.
Availability and workload viewed together
So Team Status combines assigned work with availability. Someone on leave has less capacity, which makes overload visible before Sarah commits the sprint.
Now she knows who is unavailable.
Team Status also brings availability into the same view. Sarah can see who is on leave, when they’ll be away, and the work currently assigned to them before committing to the sprint.
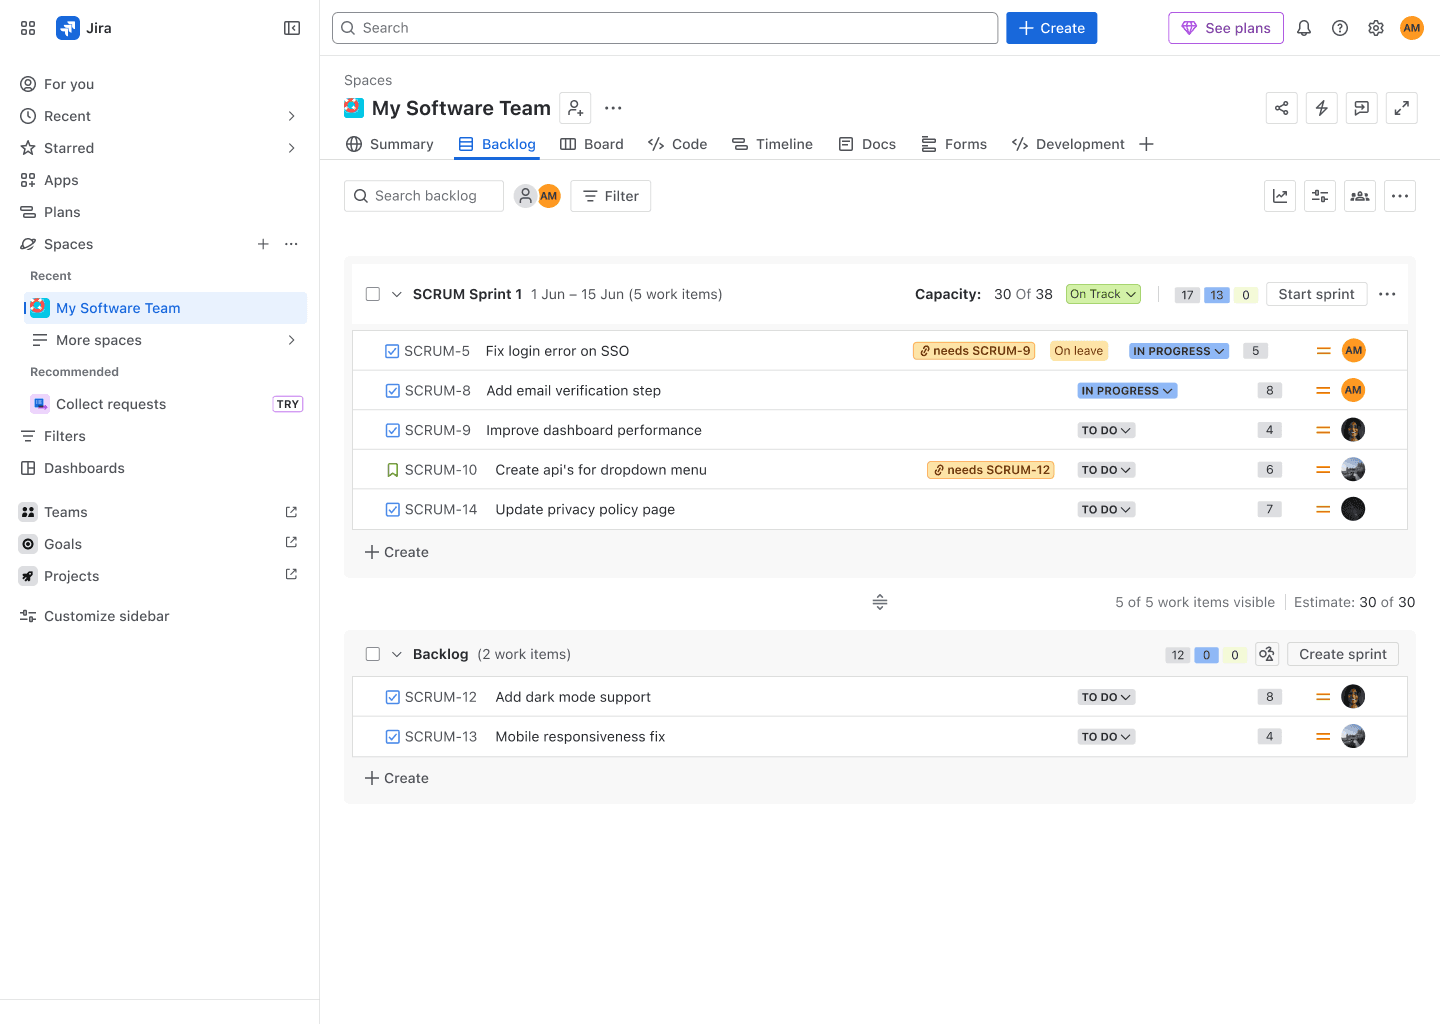
Leave visibliity directly on the task bar
First, I considered showing leave directly on the task. If an assignee was going to be away, the task would carry a warning similar to a dependency.
I also considered showing leave as a separate list. It would make absences easy to find, but separate leave from the workload it actually affects.
Leave visibility in the team status
So I kept leave inside Team Status. Sarah sees each person's workload and availability together. If someone is away, she can expand their row to see when they're unavailable and which tasks may need attention.
Availability and workload aren't separate problems. When someone is away, the team's capacity changes and their work may affect other tasks. Keeping both together makes that impact visible before the sprint starts.
Now she knows if tasks are blocked before the sprint starts.
Dependency badges sit directly on the task card visible the moment Sarah is deciding whether to drag that task into the sprint. Not buried inside the ticket. Not in a separate risk view she has to go looking for.
I considered a dedicated dependencies panel. Cleaner screen, but it means Sarah has to already suspect a problem before she goes looking. That defeats the point. The failure mode I'm solving is that she doesn't know to look. So the badge has to be where her eyes already are.
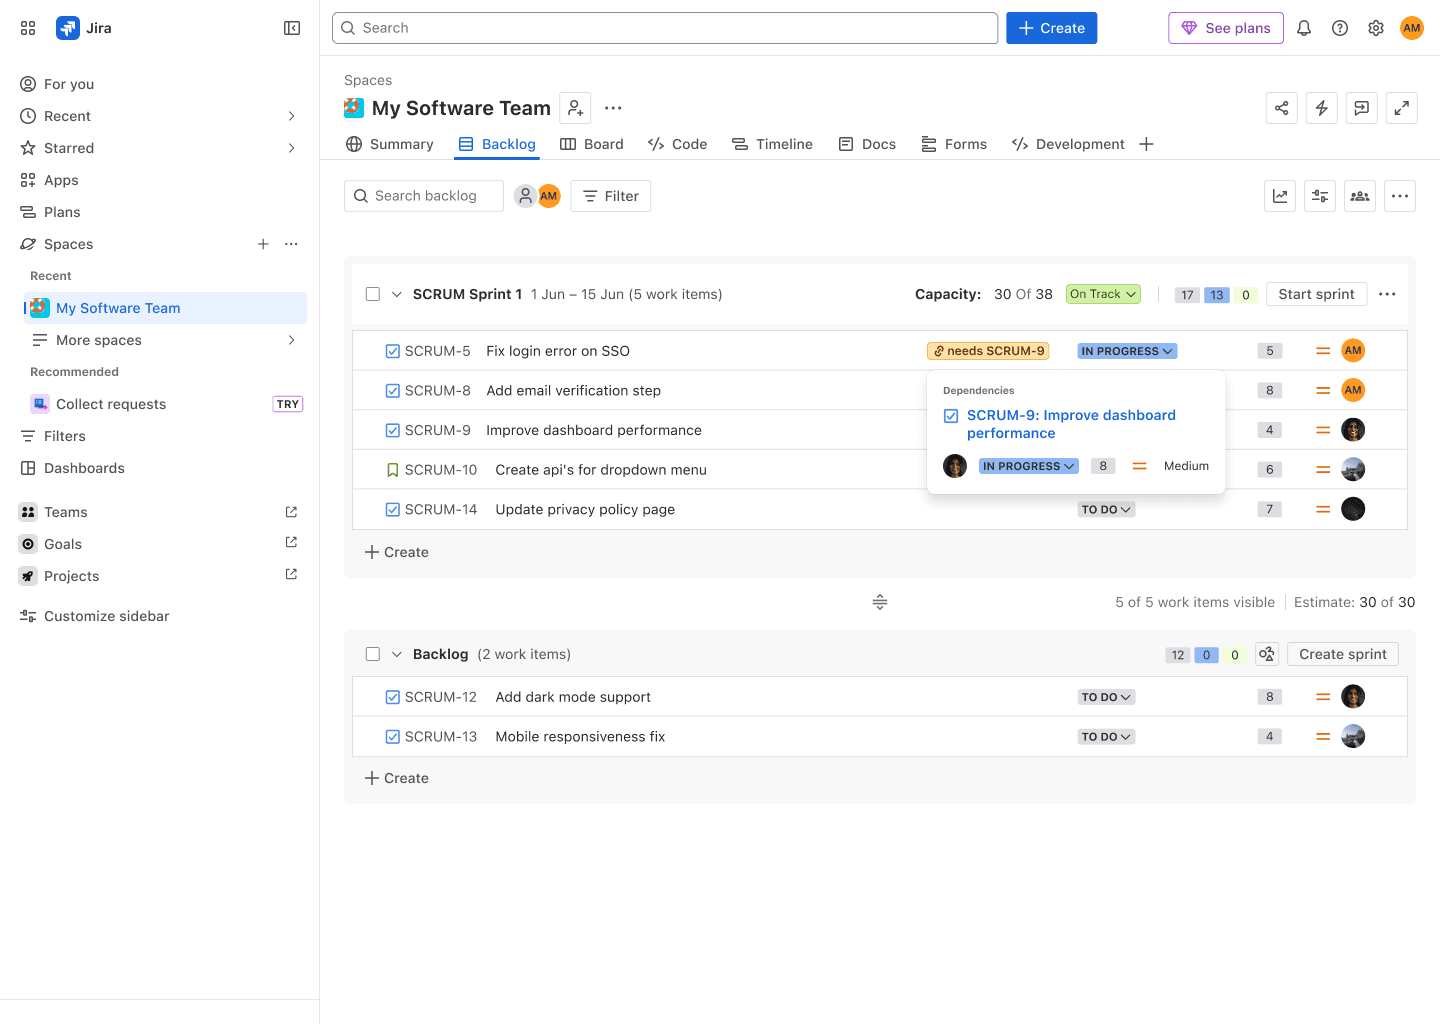
Dependencies badges on the task directly
Hover the badge and a card opens — task name, status, assignee, points, priority. If the dependency is sitting in the backlog and not in this sprint, the card tells her. One click adds it. One click removes the blocked task. Decision made without leaving the screen.
How I would validate the impact
Scattered planning signals
Check Jira for assigned work
Open calendar to check availability
↩ Switch back, re-orient to site
Ask teammates about leave or workload
Manually identify blocked tasks
Estimate if the sprint feels realistic
Low confidence before commitment
PMs make sprint decisions by connecting information themselves.
Connected planning system
Capacity recommendation based on past velocity
Scroll, copy image 2 — still on site
Dependencies surfaced during planning
Risks identified before sprint starts
One place to evaluate sprint feasibility
More informed sprint decisions
PMs understand the risks before committing the sprint.
Metrics are defined as validation signals for a future Jira implementation. Sprint predictability would be measured through planned vs completed story points and sprint carryover. Planning effort would be measured by tracking external tool usage and time spent preparing sprints. Capacity recommendations would be validated against previous sprint velocity, while dependency and workload visibility would be measured by how early risks are identified before the sprint begins.
Jira already had the information needed for better sprint planning the challenge was that PMs had to connect it themselves.
This project turned those scattered signals into a connected planning experience where capacity, availability, and dependencies support one decision: whether the sprint is realistic.
While not shipped, this concept was designed end-to-end with a clear validation plan to measure sprint predictability, planning effort, and early risk detection.
A designer's role is not just to design interfaces, but to shape better decisions.